

Research Manual 5th Edition – Profession Analysis

 Team Management Profile
TMS Research Paper — Mapping work preferences across 295 professions worldwide
Profession Analysis
RM5 contains a worldwide profession database of 295 professions in the Team Management Profile Questionnaire sample. The distinction between coded professions and non-professions depends on whether a specific qualification must be obtained for a person to hold that position, i.e., doctor, lawyer/solicitor, forensic scientist, fire-fighter, or boilermaker. Analyses cover 135 professions with 100 or more respondents.
Key Findings
- The profession samples with the highest mean Extrovert score are Media/Public Relations Specialist (7.4) and Fundraiser (6.8).
- The profession samples with the highest mean Introvert score are Draftspersons (4.4) and Geographic Information Systems Specialists (3.6).
- The highest mean score for Creative information-gathering is 5.2 for Architects, followed by Psychologists and Multimedia Designers/Artists which both recorded 4.9.
- The profession samples with the highest mean score for Practical information-gathering are Paralegals (7.9) and Personal/Executive Assistants (7.5).
- The highest mean scores for Analytical decision-making are Geoscientists and Geophysicists (16.5).
- The highest mean score for Beliefs decision-making is 0.34 for Priests/Ministers of Religion/Pastors/Chaplains.
- The profession sample with the highest mean Structured score is 8.8 for Engineers: Industrial, very closely followed by Hospitality Workers at 8.6.
- The profession samples with the lowest mean Flexible score are Guidance/Career Counsellors (0.1) and Psychologists (0.2).
Key Insight: Profession data reveals striking variation: Geoscientists score highest on Analytical decision-making (16.5) while Priests/Ministers show the strongest Beliefs orientation — evidence that profession and work preferences are closely aligned.
Percentile norms allow cross-profession comparisons. For instance, when comparing Geoscientists (mean Analytical score: 16.5) to Priests/Ministers using those same percentile norms, 94% of clergy score lower on the Analytical scale.
Role Preference Distribution Comparisons
The data presents comparative major role preference distributions across several professions:
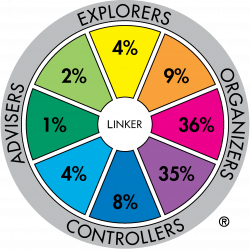
- Armed Forces – NCO (n=138) vs Arts & Media Professionals (n=360): The Armed Forces sample shows 7% representation in the Adviser–Explorer sectors, while 37% of the Arts and Media sample have major role preferences in the Adviser–Explorer part of the Wheel.
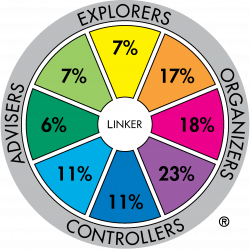
- Paralegal (n=119) vs Aged/Disability Care Worker (n=113): The Upholder–Maintainer sector is 11 times higher in the Care Worker sample. Of the 135 Profession samples reported, the paralegal sample has the highest representation of Concluder–Producers (39%).
- Accountant (n=12,153): Shows strong representation in Thruster–Organiser and Concluder–Producer sectors.
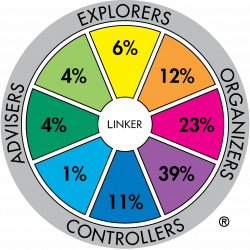
- R&D Managers at Hewlett Packard Laboratories (n=132): 23% of respondents were in the Creator–Innovator sector compared with only 17% in the Concluder–Producer sector. Many displayed split Wheel preferences between Creator–Innovator and Thruster–Organiser sectors.


Interpretation and Validity
Profession data analyses provide evidence for criterion-related validity studies. Most of the 135 Profession data sets show a relationship between role preference and the Type of Work which is important in carrying out that job function. Two mechanisms operate: people are attracted to roles matching their preferences, and the job demands can have a substantial influence in changing people’s work preference, particularly as they develop new skills and grow in the job. A two-thirds overlap between preferences and work seems to be an ideal goal. McCann, D.J., & Mead, N.H.S., (Eds.), (2018), Team Management Systems Research Manual: 5th Edition, Team Management Systems, Brisbane, and York.
Professions in the Research Database
Coverage in the TMS worldwide profession dataset
Distinct professions catalogued in the RM5 worldwide sample
Meeting the threshold for meaningful profession-level comparisons